Difference between revisions of "WCmore's Graphs"
m (→twcweather.forecast.daypart[0]) |
m (→twcweather.forecast.daypart[0]) |
||
| Line 1: | Line 1: | ||
| + | <div id="daypart"></div> | ||
== twcweather.forecast.daypart[0] == | == twcweather.forecast.daypart[0] == | ||
Revision as of 21:56, 30 March 2019
twcweather.forecast.daypart[0]
Twice a day the data stored under twcweather.forecast.daypart[0] changes. Preliminary tests over 15 days (31 data points) shows it changes sometime between 3:00 and 3:30. Often it happens within the first ten minutes, but I have seen it change over much later on occasions.
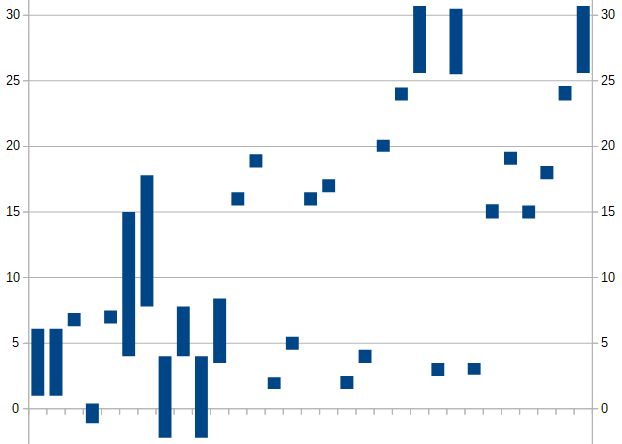
Here is a quick graph to show how much it varies day by day. (the numbers show how many minutes past 3 AM/PM)
The change over can not trigger a piston, so to determine the time it changes I have to query it multiple times, and take note of when it changes. The long bars is when I was checking every 5 or 10 minutes... The short bars is when I was checking every minute (to narrow it down more precisely).
For those wanting a reliable piston, I would make your queries at 3:35 AM/PM or later to assure that you are getting the new data. On the other hand, if you want to capture the old data right before it vanishes, I would grab that at 2:55 AM/PM.


